Viewing MySQL Document Store Queries in HeatWave Using Database Management

In a post from last year, I talked about how we can view the SQL queries that are run whenever we use the MySQL Document Store API to return JSON documents. If you did not know, when using the Document Store API, the commands are translated into SQL and executed against the database. Sometimes, it is helpful to view the queries to understand how the data is retrieved or manipulated. Now that Database Management in Oracle Cloud Infrastructure is available for MySQL HeatWave instances, I discovered a slightly easier method for viewing these queries.
Getting to Database Management
Let’s talk about how you can view queries that were run against a MySQL HeatWave instance.
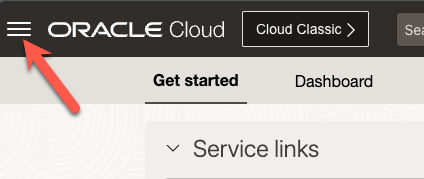
Log in to Oracle Cloud and click the hamburger menu.
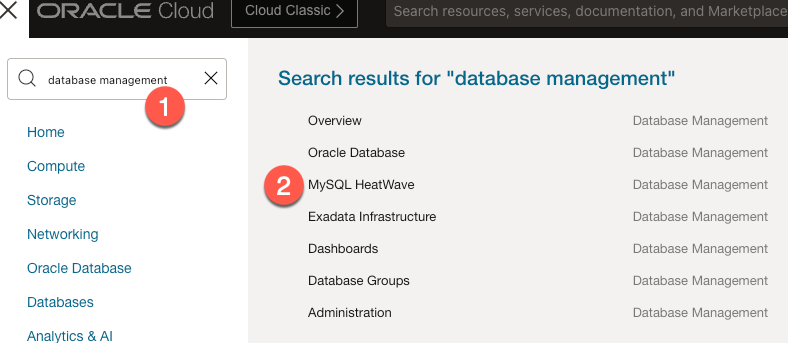
In the search box that pops up, enter database management (1) and click the “MySQL HeatWave Database Management” link (2).
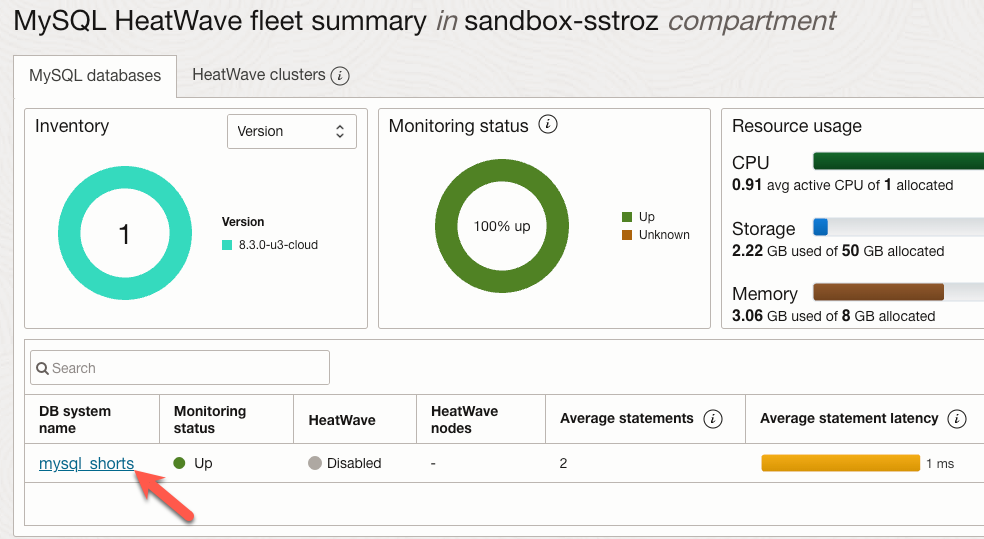
This link will cover the “MySQL HeatWave fleet summary” page for the chosen compartment. On this page, you can view information about all the MySQL HeatWave instances in the compartment. You can also view a list of instances. In this case, we have a single instance used for MySQL Shorts demos. From this list, click the instance against which you will run Document Store commands. For this post, we will use the “MySQL Shorts” instance.
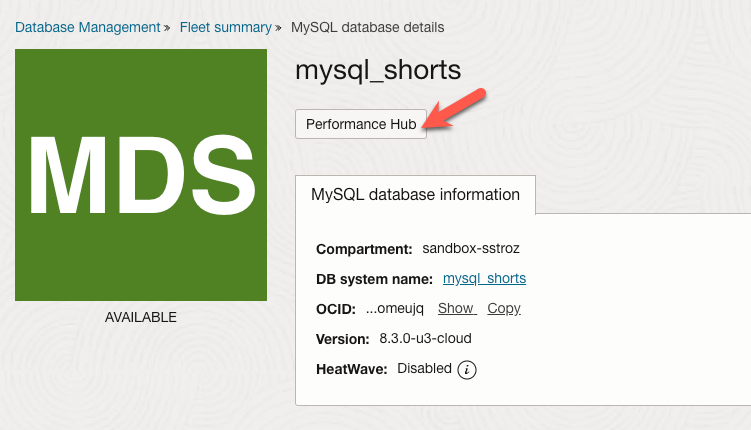
On the “MySQL Database Details” page, click the “Performance Hub” button.
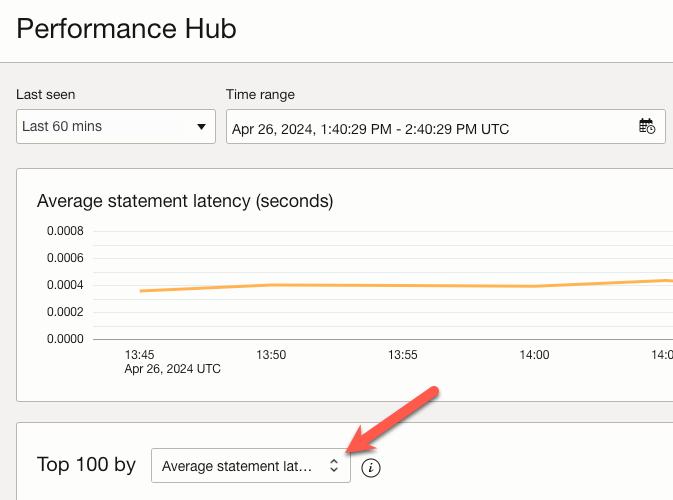
On the “Performance Hub” page, you can see information about the chosen MySQL HeatWave instance. At the bottom of the page, you can see a list of queries executed against the instance. By default, the queries are sorted by ‘Average statement latency’.
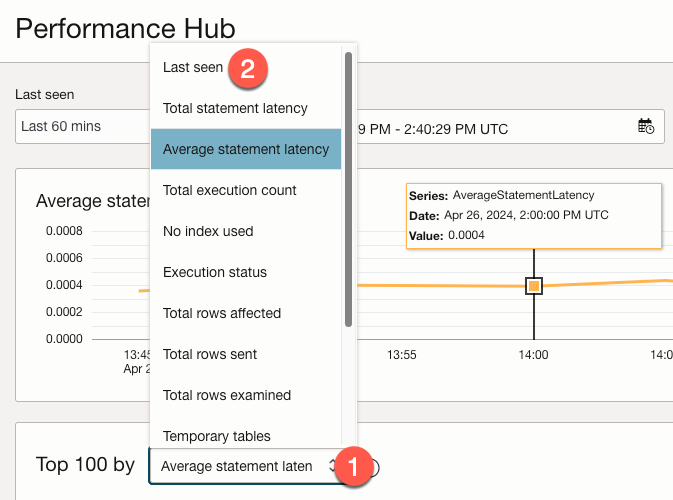
To see the most recent queries more easily, click the dropdown box (1) and select “Last seen” (2).
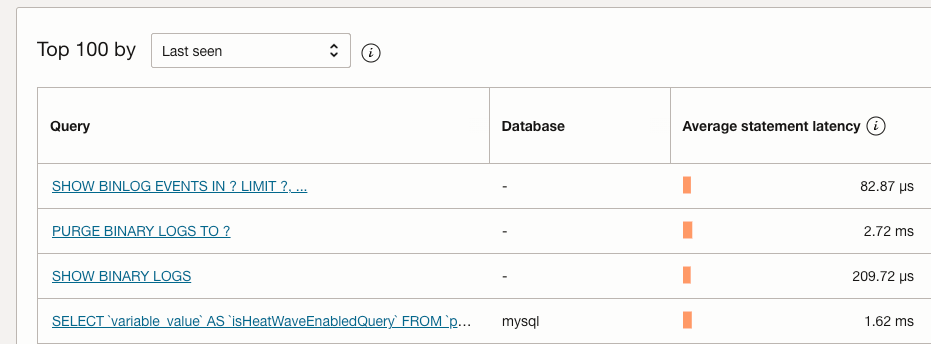
We will now see the list of queries sorted by when they were executed in descending order (with the most recent queries on top).
Running a Basic find() Command
We are going to connect to the same MySQL HeatWave instance using MySQL Shell and run the following command against a collection named restaurant in my database.
db.restaurant.find()
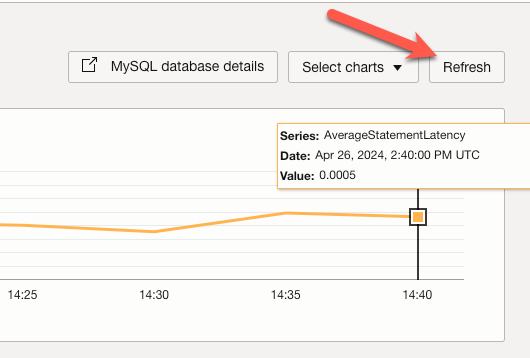
After running this command, the results will be in the console. When the command has been completed, head back to the Performance Hub for the instance we are using and click the “Refresh” button in the upper right corner.
When the data refreshes, we will see an item in the list that looks like the following.
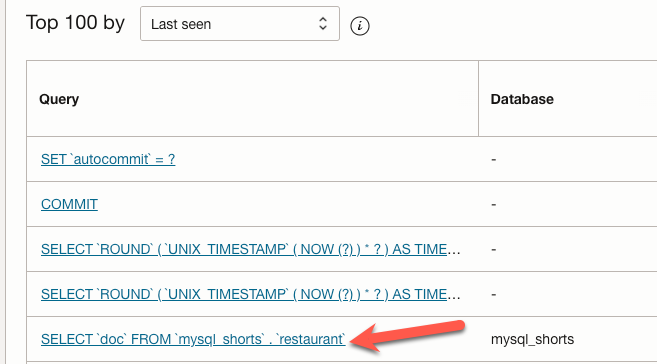
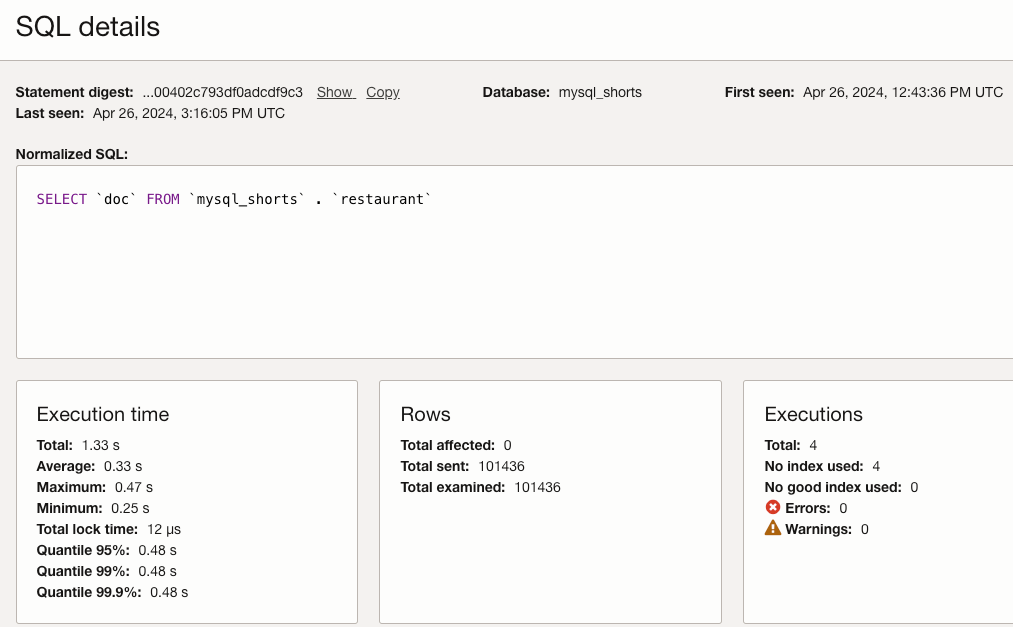
If we click on the link for the query, a modal window will open up and show details about the query.
More Complex Example
Let’s try a more complex example. The Document Store command below will generate a slightly more involved query.
db.restaurant.find("cuisine = 'Pizza'").fields(['name', 'borough']).sort('name')
This command will fetch documents where the cuisine property is “pizza”, but it only returns the name and borough properties and sorts the results by the name property.
After running this command, jump back to the “Performance Hub” and click “Refresh”. We should see a query that resembles the following:
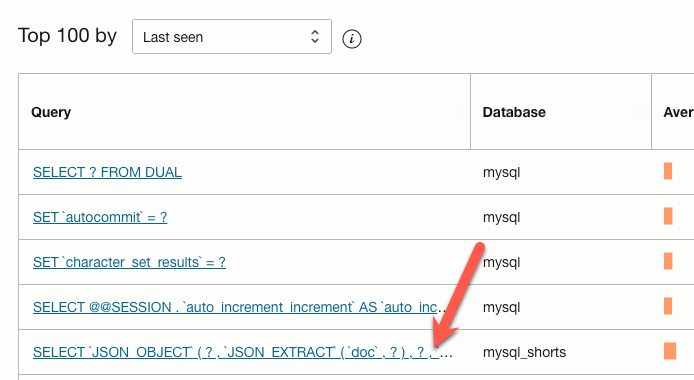
When we click the link and look at the details, we will see something that resembles the following:
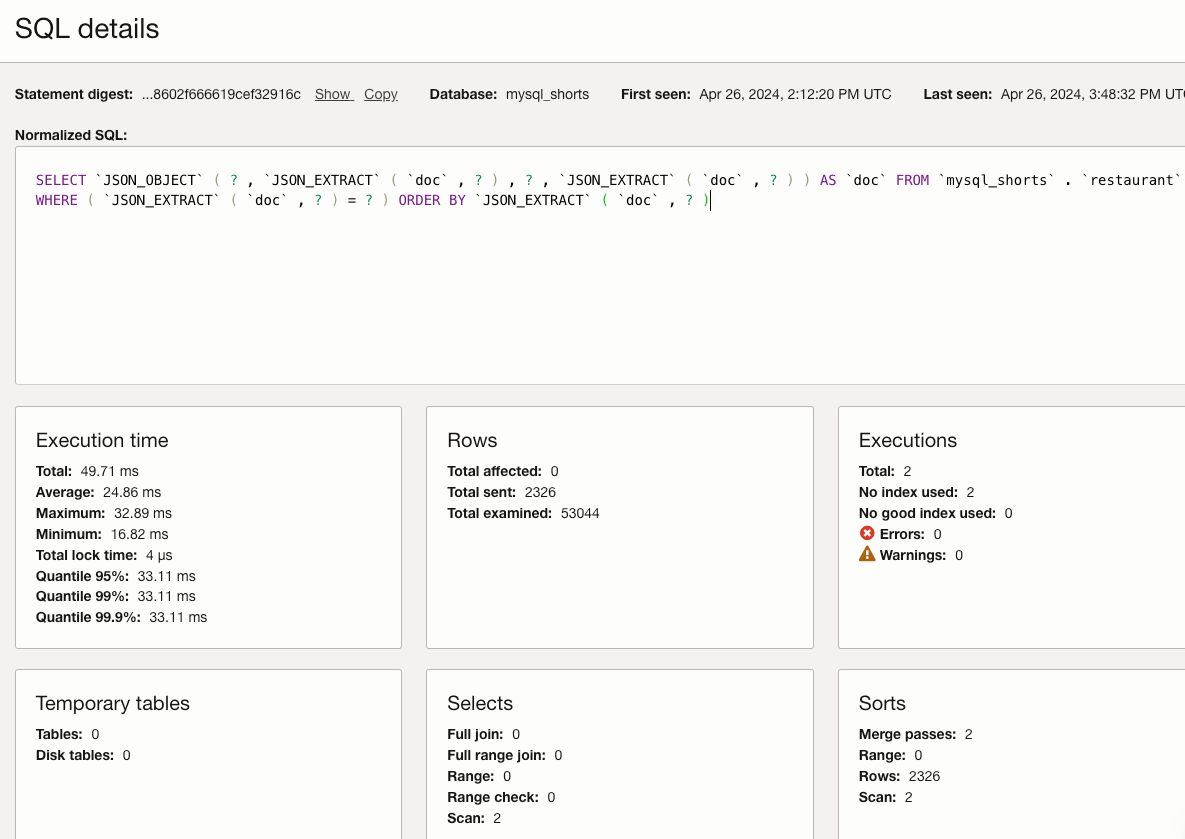
Note that we do not see the full query. Rather, some of the values are parameterized (?). It would be nice if we could see what the parameter values were, but we can easily plug them in from our command if we want to execute the query manually. This method is a little better than the previous method I discussed because you can compare multiple queries more easily.
Wrap-Up
The new Database management for MySQL HeatWave instances allows us to view details of queries executed against a specific HeatWave instance. Using this method, we can easily look at and compare queries generated when running MySQL Document Store commands. While more complex queries may have parameters listed in the query details instead of the values used, it is easier to see recent queries and compare their structure to other queries.
Photo by Tima Miroshnichenko
